Highland Prep vs. Willow Canyon High School
Should you attend Highland Prep or Willow Canyon High School? Visitors to our site frequently compare these two schools. Compare their rankings, test scores, reviews and more to help you determine which school is the best choice for you.
School Overview
School
Top Rankings
Highland Prep ranks among the top 20% of public schools in Arizona for:
Category
Attribute
Overall Rank
Reading/Language Arts Proficiency
Graduation Rate
Diversity
Willow Canyon High School ranks among the top 20% of public schools in Arizona for:
Category
Attribute
Reading/Language Arts Proficiency
Graduation Rate
Diversity
Overview
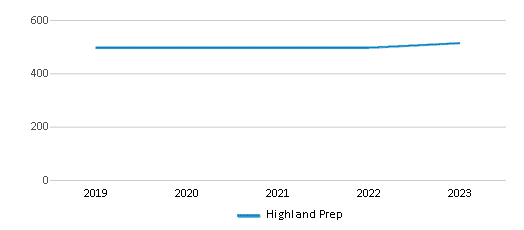
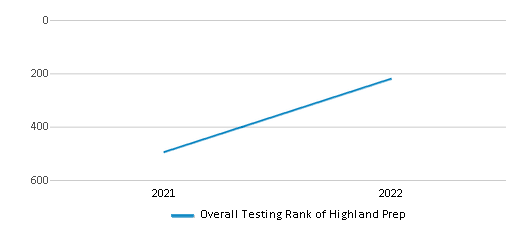
Serving 501 students in grades 9-12, Highland Prep ranks in the top 20% of all schools in Arizona for overall test scores (math proficiency is top 30%, and reading proficiency is top 30%).
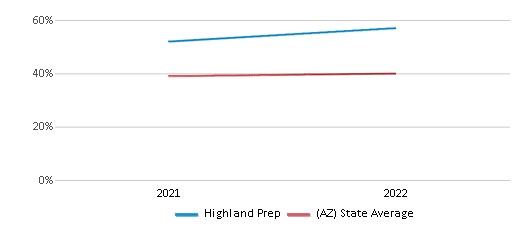
The percentage of students achieving proficiency in math is 45-49% (which is higher than the Arizona state average of 34%). The percentage of students achieving proficiency in reading/language arts is 55-59% (which is higher than the Arizona state average of 40%).
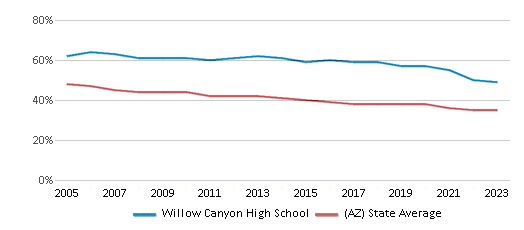
Minority enrollment is 54% of the student body (majority Hispanic), which is lower than the Arizona state average of 66% (majority Hispanic).
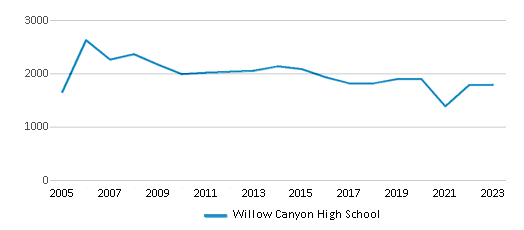
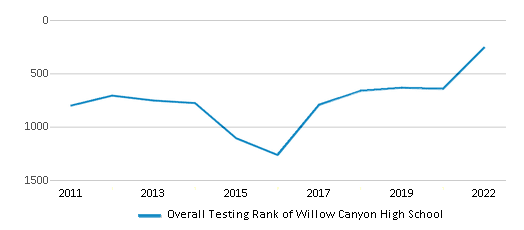
Serving 1,819 students in grades 7-12, Willow Canyon High School ranks in the top 30% of all schools in Arizona for overall test scores (math proficiency is top 50%, and reading proficiency is top 50%).
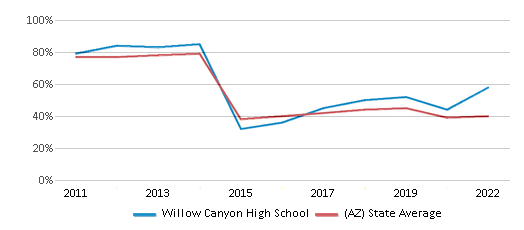
The percentage of students achieving proficiency in math is 40% (which is higher than the Arizona state average of 34%). The percentage of students achieving proficiency in reading/language arts is 58% (which is higher than the Arizona state average of 40%).
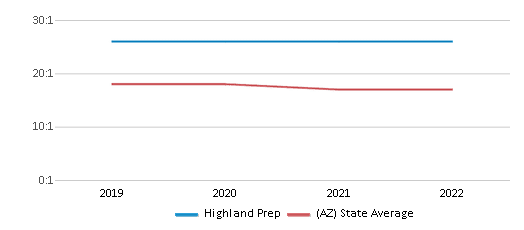
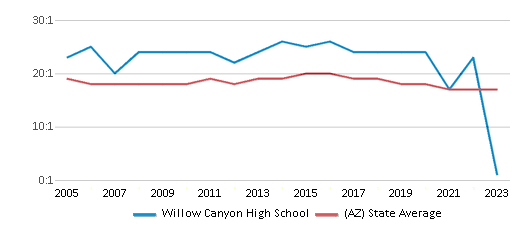
The student-teacher ratio of 23:1 is higher than the Arizona state level of 17:1.
Minority enrollment is 52% of the student body (majority Hispanic), which is lower than the Arizona state average of 66% (majority Hispanic).
Grades Offered
9-12
7-12
Total Students
501 students
1,819 students
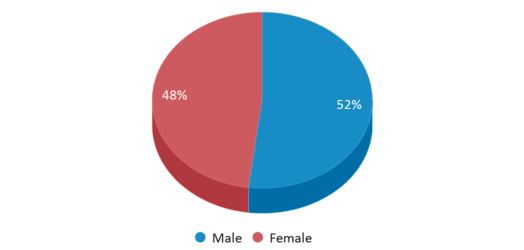
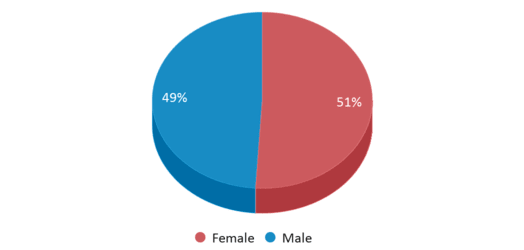
% Male | % Female
52% | 48%
49% | 51%
Total Classroom Teachers
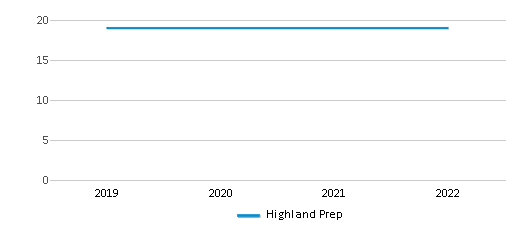
19 teachers
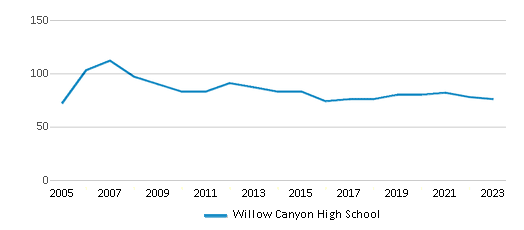
78 teachers
Student-Teacher Ratio
n/a
23:1
Test Scores
Overall Testing Rank
#381 out of 1921 schools in AZ
(Top 20%)
(Top 20%)
#468 out of 1921 schools in AZ
(Top 30%)
(Top 30%)
Math Test Scores (% Proficient)
45-49%
40%
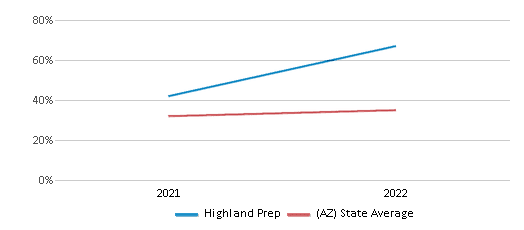
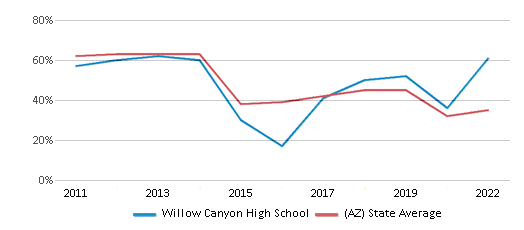
Reading/Language Arts Test Scores (% Proficient)
55-59%
58%
Science Test Scores (% Proficient)
35-39%
29%
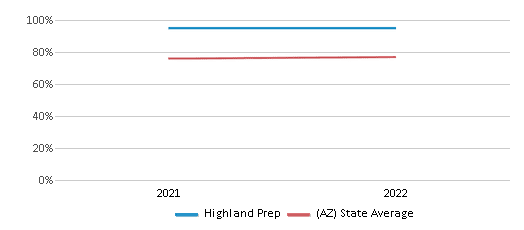
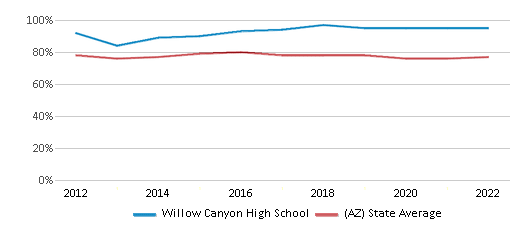
Graduation Rate
≥95%
97%
Students by Grade
Students by Grade
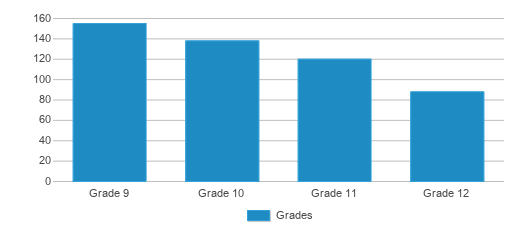
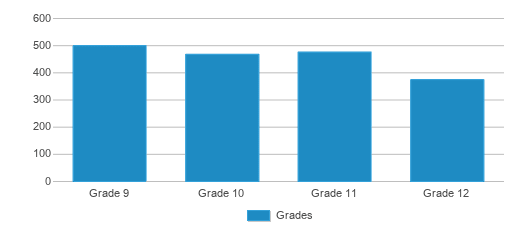
Grade 9 Students
155
500
Grade 10 Students
138
468
Grade 11 Students
120
476
Grade 12 Students
88
375
Students by Ethnicity
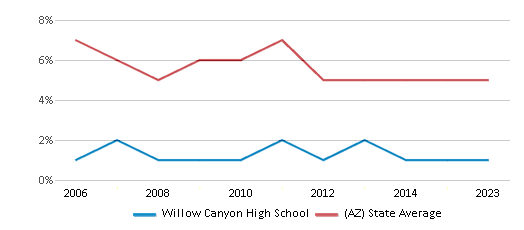
% American Indian
1%
1%
n/a
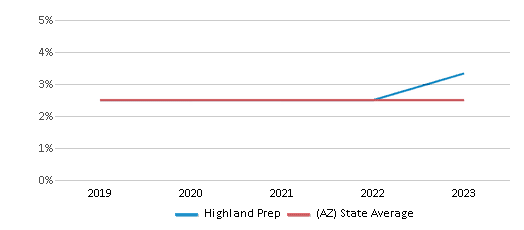
% Asian
3%
2%
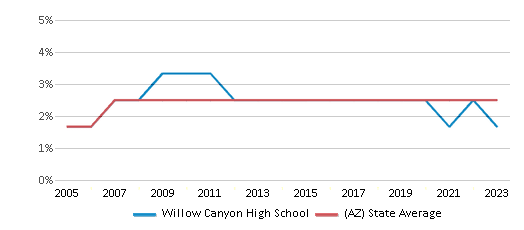
% Hispanic
36%
34%
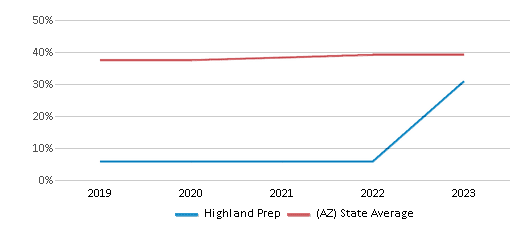
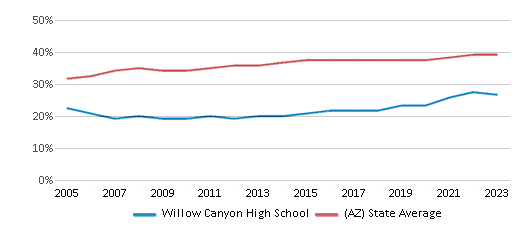
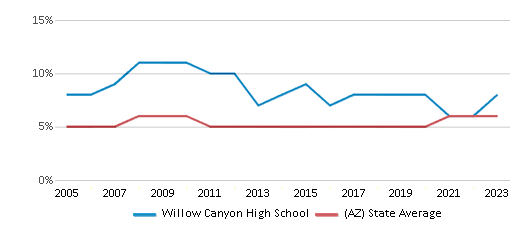
% Black
8%
7%
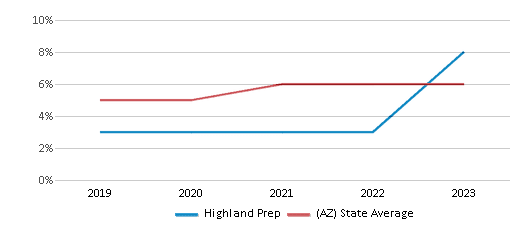
% White
46%
48%
% Hawaiian
1%
1%
% Two or more races
5%
7%
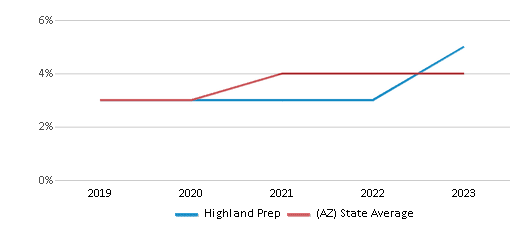
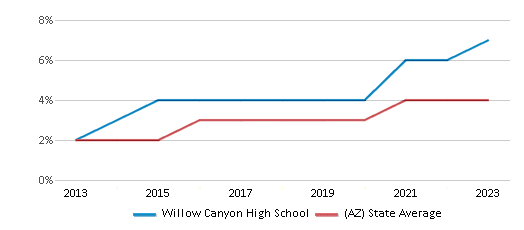
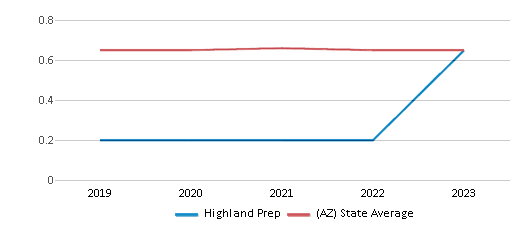
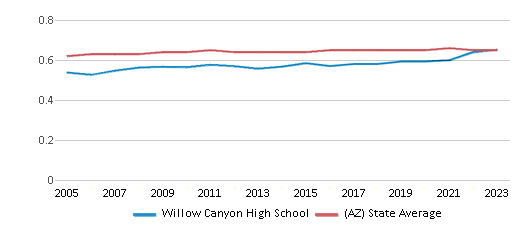
Diversity Score
0.66
0.65
Additional Information
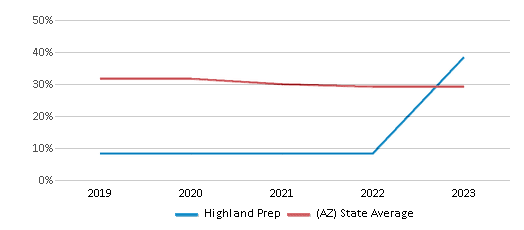
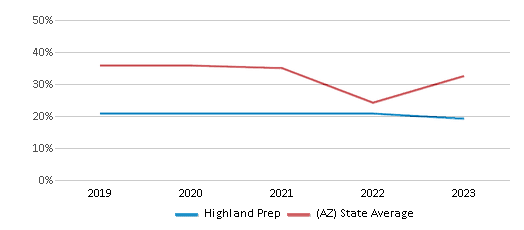
Eligible for Free Lunch
23%
27%
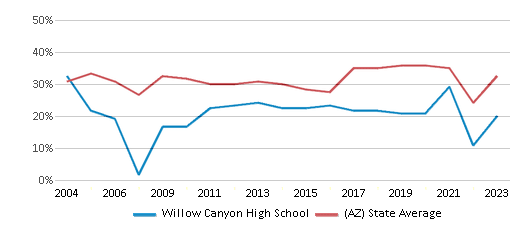
Eligible for Reduced Lunch
11%
7%
n/a
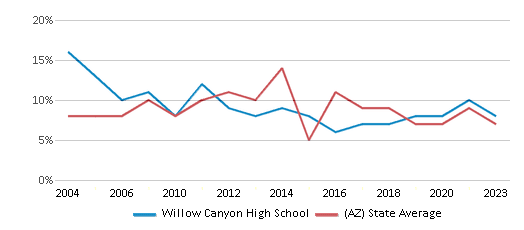
Sports
Total Sports Offered
11
n/a
Sports
BaseballBasketball
CheeringCross Country
FootballSoccer
SoftballTennis
TrackTrack and Field
Volley Ball
BaseballBasketball
CheeringCross Country
FootballSoccer
SoftballTennis
TrackTrack and Field
Volley Ball
Extracurriculars
Total Extracurriculars
32
n/a
Extracurriculars
Club or Organization:
Recreational Athletic Programs:
Anime ClubChess Club
Drone RacingE-Sports
Engineering ClubFuture Medical Professionals
GSAMath Club
National Honor SocietyPep Band
Performance ChoirPhotography Club
Sea PerchSpanish Club
Speech and DebateStreaming Club
Student CouncilTable Tennis
VEX RoboticsYearbook
Zoology Club
Recreational Athletic Programs:
BaseballCross Country
FootballMen's Basketball
Men's SoccerSoftball
TennisTrack and Field
VolleyballWomen's Basketball
Women's Soccer
